Getting shrinkage right in injection molding is like hitting a bullseye every time. It takes precision and a bit of know-how.
Shrinkage in injection molding is calculated by the formula: Shrinkage = (Mold Dimension – Part Dimension) / Mold Dimension, aiding in predicting size changes during cooling for accurate final product fit.
I remember the first time I tackled shrinkage in my designs—it felt like a puzzle waiting to be solved. The formula is straightforward, but the real challenge comes with variables like material types and mold intricacies. Over the years, I’ve learned that understanding these nuances can make or break a project. So let’s explore how different factors influence shrinkage and how you can master them to ensure your designs are spot-on every time.
Shrinkage formula is universal for all plastics.False
Different materials have unique shrinkage rates, affecting the formula.
Mold design impacts shrinkage in injection molding.True
Mold design influences cooling rates, affecting part dimensions.
- 1. What Factors Affect Shrinkage in Injection Molding?
- 2. How does choosing the right material affect shrinkage in manufacturing?
- 3. What Are Common Mistakes When Calculating Shrinkage?
- 4. How Can You Optimize Mold Design for Minimal Shrinkage?
- 5. What Tools and Software Can Help Predict Shrinkage Accurately?
- 6. Conclusion
What Factors Affect Shrinkage in Injection Molding?
Ever felt like your carefully designed plastic part had a mind of its own, refusing to fit just right?
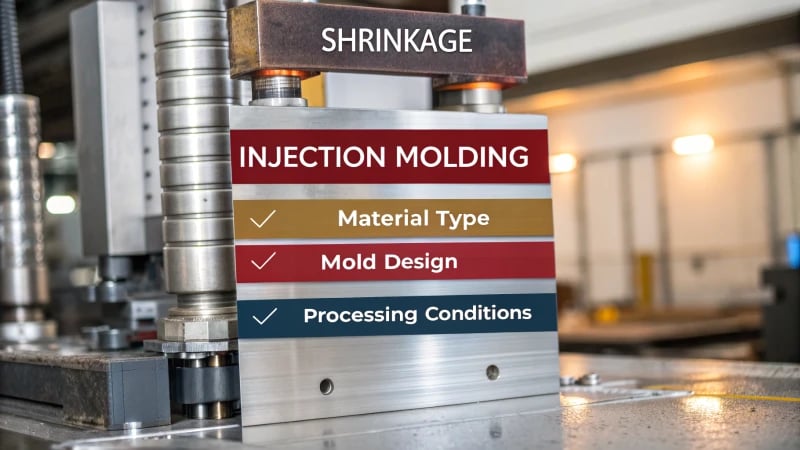
Shrinkage in injection molding is influenced by material type, mold design, and processing conditions, which together determine the extent of contraction as the part cools and solidifies.
When I first got into injection molding, I was amazed at how much science and art go into making sure a part comes out just right. It’s like cooking a complicated dish where every ingredient and step needs to be perfect.
Material Type and Properties
One thing I’ve learned from countless projects is that not all plastics are created equal. The material you choose can make or break your design—quite literally. Crystalline polymers like polyethylene tend to shrink more than amorphous ones like polycarbonate. I remember a project where we switched materials mid-process, and the difference in shrinkage rates was eye-opening. Understanding the thermal properties of your material is crucial to avoiding those nasty surprises.
| Material | Shrinkage Rate |
|---|---|
| Polyethylene | High |
| Polycarbonate | Low |
| Nylon | Medium |
Material selection1 plays a vital role in this process.
Mold Design Considerations
Ah, mold design—where the magic truly happens. Early in my career, I learned the hard way how uneven wall thickness could cause parts to warp. It’s like baking a cake: if the batter isn’t evenly spread, you end up with a lopsided dessert. Ensuring uniform wall thickness helps in achieving consistent shrinkage, which means fewer headaches down the road.
Another trick is strategic placement of cooling systems2. Think of it as giving your cake an even chill before icing; it keeps everything in place.
Processing Conditions
Processing conditions might sound technical, but they’re essentially the dials and knobs you tweak to get things just right. Adjusting parameters like injection speed, pressure, and temperature can vastly influence shrinkage. For instance, higher injection pressure can pack more material into the mold, reducing shrinkage—much like compressing a spring.
I’ve seen teams use advanced computer-aided engineering (CAE) tools to simulate these conditions, allowing for precise adjustments that save time and money in the long run. Tweaking injection speed3 is another clever approach that can help tackle defects related to shrinkage.
When I consider all these elements together, it’s clear that understanding them isn’t just about getting a part that fits; it’s about mastering a craft that combines creativity with precision. By optimizing these factors, we can ensure that our designs not only meet quality standards but also delight clients with their reliability and performance. That’s what makes this field so exciting and rewarding.
Polycarbonate has a higher shrinkage rate than polyethylene.False
Polycarbonate has a lower shrinkage rate compared to polyethylene.
Uneven wall thickness can cause differential shrinkage.True
Uneven wall thickness leads to inconsistent cooling, causing warping.
How does choosing the right material affect shrinkage in manufacturing?
Have you ever picked the wrong material for a project and ended up with a wonky, out-of-shape product? I know I have, and it taught me just how crucial material choice is in managing shrinkage during manufacturing.
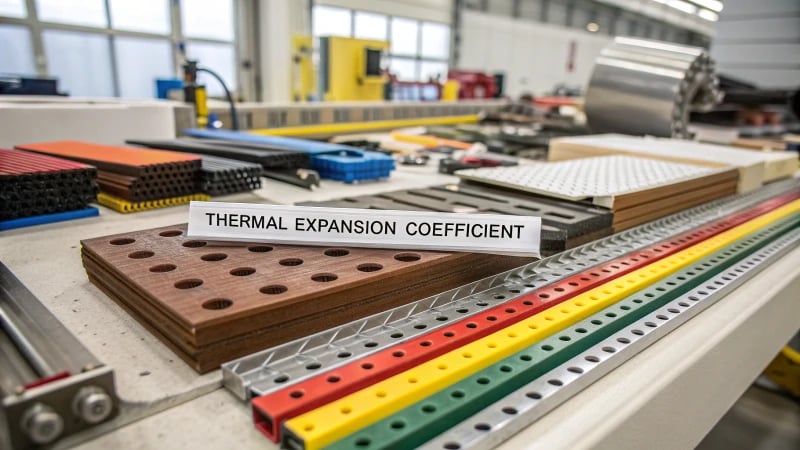
Choosing the right material is crucial in manufacturing to control shrinkage rates, as materials with higher thermal expansion can lead to greater shrinkage. Understanding material properties ensures precise dimensional outcomes.
Material Properties and Their Influence
Let me take you back to a time when I was working on designing a small batch of electronic casings. I thought I had everything figured out until I noticed they were all slightly off in dimensions. It turned out the material I’d chosen had higher shrinkage rates than expected. This taught me the hard way about how different materials, like polypropylene (PP) and acrylonitrile butadiene styrene (ABS), behave differently due to their molecular structures4.
| Material | Shrinkage Rate |
|---|---|
| Polypropylene | 1.5% – 2.0% |
| ABS | 0.5% – 0.7% |
PP, for instance, has a lower density and higher thermal expansion coefficient, which means it contracts more as it cools. This was a game-changer for me in choosing the right materials for projects that demanded precision.
Impact of Cooling Rate
I’ve also learned that it’s not just about the materials but how they’re cooled. I recall a time when we rushed a batch through production, cooling it too quickly. The resulting internal stresses caused unexpected deformations. Materials like polystyrene require careful cooling management to avoid such issues.
In injection molding, managing mold temperatures is crucial to reduce differential shrinkage, ensuring uniformity across products. This bit of wisdom has saved me countless headaches in my projects.
Case Study: EVA vs. Resin
There’s a story about when I was tasked with choosing between ethylene-vinyl acetate (EVA) and resin for a new product line. EVA’s flexibility seemed ideal for shoe soles but came with a trade-off of higher shrinkage rates.
| Material | Application | Shrinkage |
|---|---|---|
| EVA | Shoe Soles | High |
| Resin | Artifacts | Low |
Resin, on the other hand, offered better dimensional stability, perfect for precision-required artifacts but lacked EVA’s flexibility.
This experience taught me that understanding these characteristics is vital to align material choices with production goals and functional requirements.
So now, when faced with material decisions, I think back on these lessons and stories. They remind me that the right choice can drastically improve both the process and the product’s performance.
Polypropylene has a higher shrinkage rate than ABS.True
Polypropylene's shrinkage rate is 1.5%-2.0%, higher than ABS's 0.5%-0.7%.
Faster cooling reduces internal stresses in materials.False
Faster cooling increases internal stresses, leading to dimensional inaccuracies.
What Are Common Mistakes When Calculating Shrinkage?
Ever been caught off guard by shrinkage mishaps in design? I have, and it taught me a lot about avoiding costly errors.
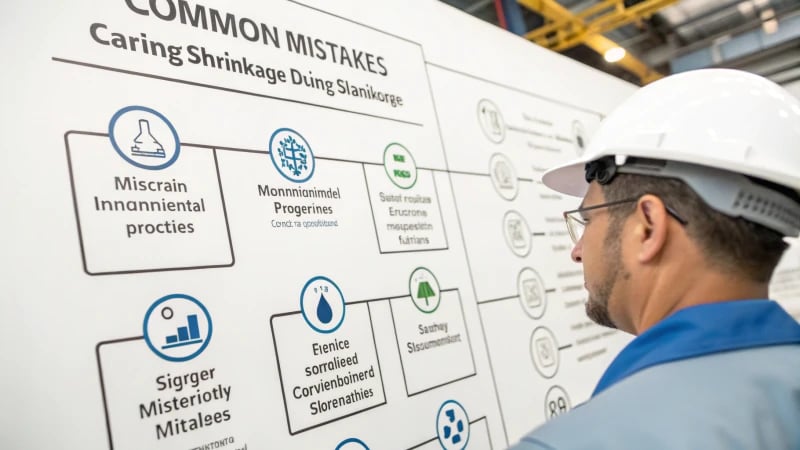
Common shrinkage calculation mistakes involve neglecting material properties, environmental impacts, and process variations, causing design inaccuracies.
Overlooking Material Properties
I remember one of my first projects where I underestimated how much ignoring material properties could cost me. I was working with plastics, assuming their shrinkage rates were similar to metals. Boy, was I wrong! Each material behaves differently under stress and heat, and not adjusting for these nuances led to a batch of parts that just didn’t fit right. It’s crucial to know your materials inside out.
| Material Type | Typical Shrinkage Rate (%) |
|---|---|
| Plastic | 1.5 – 2.0 |
| Metal | 0.5 – 1.0 |
| Rubber | 2.5 – 3.5 |
Ignoring Environmental Factors
I’ll never forget the time I ignored the impact of environmental conditions on my designs. It was a humid summer, and the warehouse was a sauna. My designs were perfect on paper, but in practice, they were a disaster due to unexpected shrinkage variations. Ever since, I’ve always accounted for temperature and humidity, often testing in a controlled environment5 to avoid such fiascos.
Neglecting Process Variations
In one project, I realized that even slight changes in the manufacturing process could lead to significant discrepancies in shrinkage outcomes. Different injection speeds or cooling times can throw your entire design off. Keeping a detailed log of these variables and including them in my calculations was a game changer for me.
Inadequate Communication with Suppliers
I learned the hard way that clear communication with suppliers is non-negotiable. Once, due to a miscommunication, I received a batch of materials with different specifications than expected. It was a costly mistake that could have been avoided by ensuring all the details were clear from the start. Collaborating closely with suppliers now gives me insights that help refine my designs and optimize calculations6.
Every step in the calculation process needs meticulous documentation and quality control measures7. It’s what keeps shrinkage rates predictable and accurate, helping me avoid costly production errors. This methodical approach has become second nature to me over the years.
Plastic shrinkage rate is higher than metal.True
Plastic typically shrinks 1.5-2.0%, while metal shrinks 0.5-1.0%.
Environmental factors have no impact on shrinkage rates.False
Temperature and humidity significantly affect material shrinkage rates.
How Can You Optimize Mold Design for Minimal Shrinkage?
Ever wondered why your injection-molded parts don’t quite fit as expected? Shrinkage might be the culprit! Let’s dive into how I tackle mold design to keep shrinkage in check.
Optimize mold design for minimal shrinkage by ensuring precise processing conditions, selecting appropriate materials, and adjusting mold elements such as gate size and cooling channels, to maintain intended dimensions and quality.
Understanding Shrinkage in Injection Molding
I remember the first time I encountered shrinkage issues—it was a real eye-opener. The parts came out smaller than expected, and I had no idea why. That’s when I learned about shrinkage: the sneaky reduction in size as a molded part cools. It’s all about the thermal contraction of polymers as they solidify. Getting familiar with material properties8 is key since every polymer behaves differently.
Key Factors Affecting Shrinkage
-
Material Selection: Picking the right polymer can feel like choosing a dessert—each one has its unique characteristics. If precision is your dessert, opt for materials with low shrinkage rates. A material shrinkage chart9 can be your best friend here.
-
Processing Conditions:
- Melt Temperature: Imagine trying to bake a cake at the wrong temperature—disaster, right? Keeping the melt temperature just right minimizes shrinkage variations.
- Packing Pressure: Think of it like stuffing a suitcase; adequate pressure ensures everything stays in place as it cools.
-
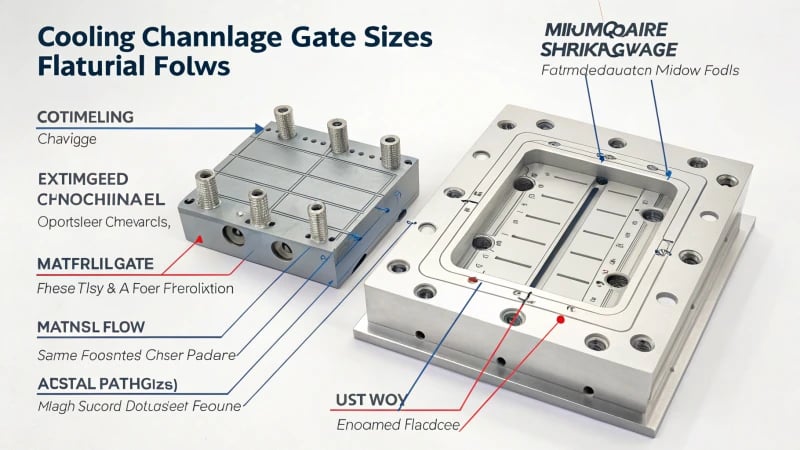
Mold Design Elements:
- Gate Design: I once tried a smaller gate to save material but ended up with uneven flow. Larger gates can help with even flow and pressure distribution.
- Cooling Channels: Properly designed cooling channels are like a good air conditioner on a hot day—essential for uniform cooling and minimizing differential shrinkage.
| Design Element | Impact on Shrinkage |
|---|---|
| Gate Size | Larger gates reduce shrinkage variation |
| Cooling Channels | Uniform cooling minimizes differential |
Advanced Techniques for Optimization
-
CAE Simulation: Before diving headfirst into production, I rely on computer-aided engineering simulations. It’s like having a crystal ball to predict and tweak shrinkage issues virtually. This saves time and resources by letting you adjust variables without costly trial-and-error.
-
Prototyping: Testing different mold designs through prototypes feels like being a detective piecing together clues. This hands-on approach helps refine the design before full-scale production hits, making sure we minimize defects and boost product quality.
By considering these factors and harnessing advanced tools, you can effectively minimize defects10 and ensure your mold design projects deliver top-notch results.
Larger gates reduce shrinkage variation.True
Larger gates allow for even flow and pressure distribution, minimizing variation.
Higher melt temperature decreases shrinkage.False
Higher melt temperatures can increase shrinkage due to greater thermal contraction.
What Tools and Software Can Help Predict Shrinkage Accurately?
When I first started in mold design, shrinkage was like a shadow lurking behind every project. Thankfully, there are tools now that shine a light on this challenge.
Tools like Autodesk Moldflow, Siemens NX, and SolidWorks Plastics accurately predict shrinkage by offering detailed simulations, aiding in minimizing errors and optimizing production.

Leading Tools for Shrinkage Prediction
I remember early on in my career, feeling like I was wrestling with an invisible opponent whenever shrinkage reared its head. But then, I discovered some amazing tools that became my go-to arsenal:
| Tool Name | Key Features |
|---|---|
| Autodesk Moldflow11 | Advanced simulation capabilities for plastic injection molding. |
| Siemens NX | Comprehensive suite with multi-physics simulation. |
| SolidWorks Plastics12 | User-friendly interface with robust analysis tools. |
Autodesk Moldflow13
Autodesk Moldflow has been a game-changer for me with its advanced simulation capabilities14. It allows me to predict how materials will behave under different conditions, reducing shrinkage and warpage issues. It’s like having a crystal ball for my designs!
Siemens NX
Siemens NX offers a comprehensive suite of simulation tools15 that integrate multi-physics analyses. This is perfect for those complex design challenges where shrinkage needs to be tightly controlled, almost like having an engineering Swiss Army knife.
SolidWorks Plastics16
SolidWorks Plastics combines an intuitive interface with powerful analysis tools. It lets me simulate the plastic flow and predict shrinkage effectively, making my design process smoother and more efficient.
Leveraging Predictive Analytics
Predictive analytics have become my secret weapon in managing shrinkage. With software solutions that utilize data analytics, I can spot patterns and trends that aren’t immediately visible.
Predictive Analytics Software17
By integrating predictive analytics software into my workflow, I can forecast potential shrinkage issues before they happen. This proactive approach enables me to implement measures that keep problems at bay.
Understanding the features of these tools is crucial because they vary based on specific needs and industry requirements. By examining each tool’s offerings closely, I can determine which aligns best with my operations. The key is finding a solution that matches both technical specifications and business objectives. Doing so not only enhances design accuracy but also significantly cuts costs linked to shrinkage errors.
To find the right fit for my manufacturing needs, I explore the myriad options available, ensuring seamless integration that boosts productivity and profitability. Consulting with industry experts or testing functionalities through trial versions helps me decide before a full-scale implementation. Adopting the right tools has led to more precise production processes and improved outcomes in product development.
Autodesk Moldflow predicts shrinkage in plastic molding.True
Autodesk Moldflow is known for its advanced simulation capabilities in predicting shrinkage.
SolidWorks Plastics lacks robust analysis tools.False
SolidWorks Plastics is noted for its powerful analysis tools in shrinkage prediction.
Conclusion
This guide explains how to calculate shrinkage in injection molding, emphasizing material selection, mold design, and processing conditions to ensure precise dimensions and minimize defects.
-
Explore material properties crucial for understanding shrinkage rates in injection molding. ↩
-
Discover how cooling systems influence shrinkage by controlling cooling rates. ↩
-
Learn about optimizing injection speed to reduce shrinkage-related defects. ↩
-
This link provides a detailed comparison of molecular structures between PP and ABS, helping you understand their impact on shrinkage. ↩
-
Learn how temperature fluctuations influence shrinkage rates and why controlled environments are essential for accuracy. ↩
-
Discover effective communication strategies with suppliers to ensure precise material specifications. ↩
-
Explore quality control techniques that enhance the accuracy of shrinkage calculations. ↩
-
Explore material properties to understand their impact on shrinkage rates, aiding in the selection of suitable materials for your design. ↩
-
A material shrinkage chart provides detailed insights into the expected shrinkage rates of various polymers, helping in precise material selection. ↩
-
Learn strategies to reduce defects in injection molding processes, ensuring high-quality production outcomes. ↩
-
Discover Autodesk Moldflow’s advanced simulation features for optimizing plastic injection molding. ↩
-
Explore SolidWorks Plastics’ intuitive interface and powerful analysis capabilities. ↩
-
Discover Autodesk Moldflow’s advanced simulation features for optimizing plastic injection molding. ↩
-
Discover Autodesk Moldflow’s advanced simulation features for optimizing plastic injection molding. ↩
-
Learn about Siemens NX’s comprehensive simulation tools for complex design challenges. ↩
-
Explore SolidWorks Plastics’ intuitive interface and powerful analysis capabilities. ↩
-
Find predictive analytics software solutions that forecast shrinkage issues in manufacturing. ↩